Observability
MolnOS Observability provides centralized logging and event tracking for all services in your MolnOS deployment. Collect, query, and analyze logs with flexible filtering and retention management.
Features
Section titled “Features”Centralized Log Collection
Section titled “Centralized Log Collection”Collect logs from all MolnOS services in a single, unified location. Each log event includes timestamp, service name, severity level, message, and optional metadata.
Flexible Querying
Section titled “Flexible Querying”Query logs with powerful filtering options:
- Time range (start/end timestamps)
- Service name
- Log level (info, warn, error, debug)
- Pagination (limit and offset)
Log Levels
Section titled “Log Levels”Four standard log levels for severity classification:
info- Informational messages about normal operationswarn- Warning messages about potential issueserror- Error messages requiring attentiondebug- Detailed diagnostic information
Event Metadata
Section titled “Event Metadata”Attach arbitrary JSON metadata to log events for structured logging. Store context, user IDs, request IDs, or any custom data alongside your log messages.
Log Statistics
Section titled “Log Statistics”View statistics about stored logs including total log file count and per-file metrics.
Log Retention Management
Section titled “Log Retention Management”Clean up old logs with configurable retention policies. Delete logs older than a specified number of days to manage storage space.
Write Buffering
Section titled “Write Buffering”Automatic write buffering for performance with manual flush capability for critical events.
System Metrics
Section titled “System Metrics”Access real-time system and process metrics on demand without background overhead. Monitor CPU load, memory usage, and Node.js process health.
Common Use Cases
Section titled “Common Use Cases”- Application Logging: Centralize logs from all your functions and services
- Error Tracking: Monitor and investigate errors across your deployment
- Audit Trails: Track user actions and system changes for compliance
- Performance Monitoring: Log request latencies and identify bottlenecks
- System Health Monitoring: Track CPU load, memory usage, and process metrics
- Security Monitoring: Track authentication attempts and access patterns
- Debugging: Diagnose issues with detailed debug-level logging
- Business Analytics: Log business events and extract insights from event data
How It Works
Section titled “How It Works”Console
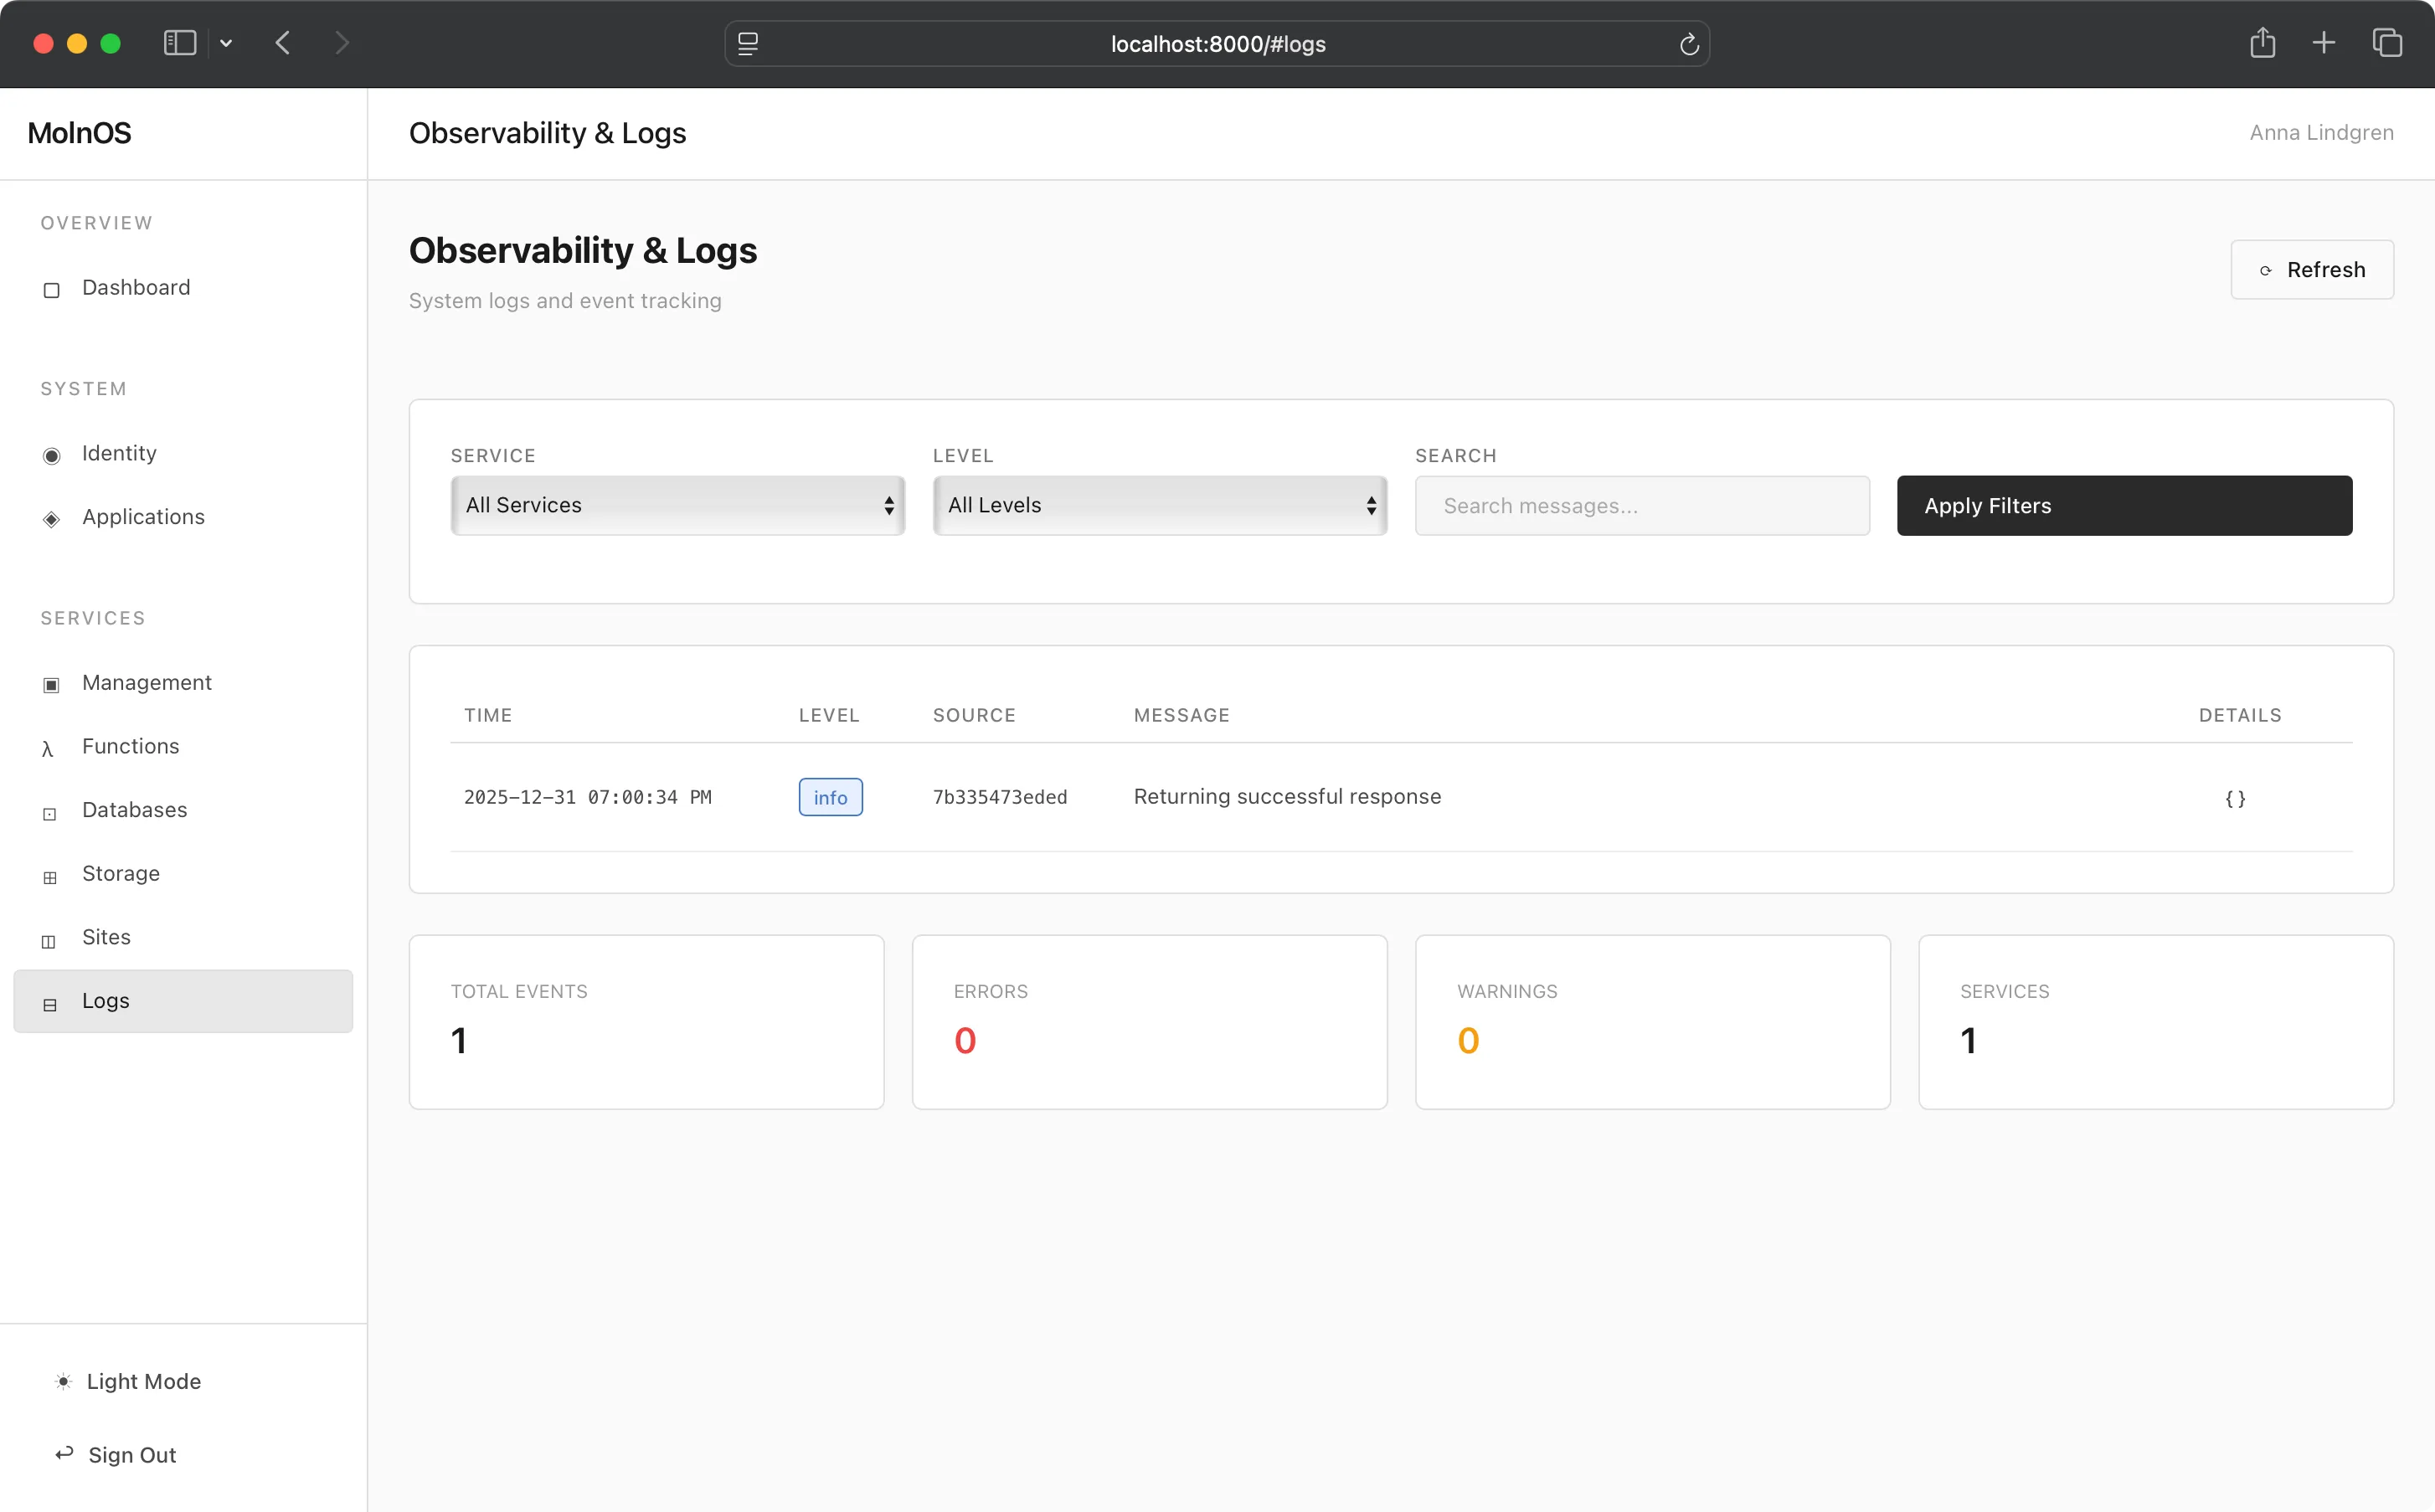
Section titled “Console”The Observability view in the Console offers a simple and useful way to look at logs.
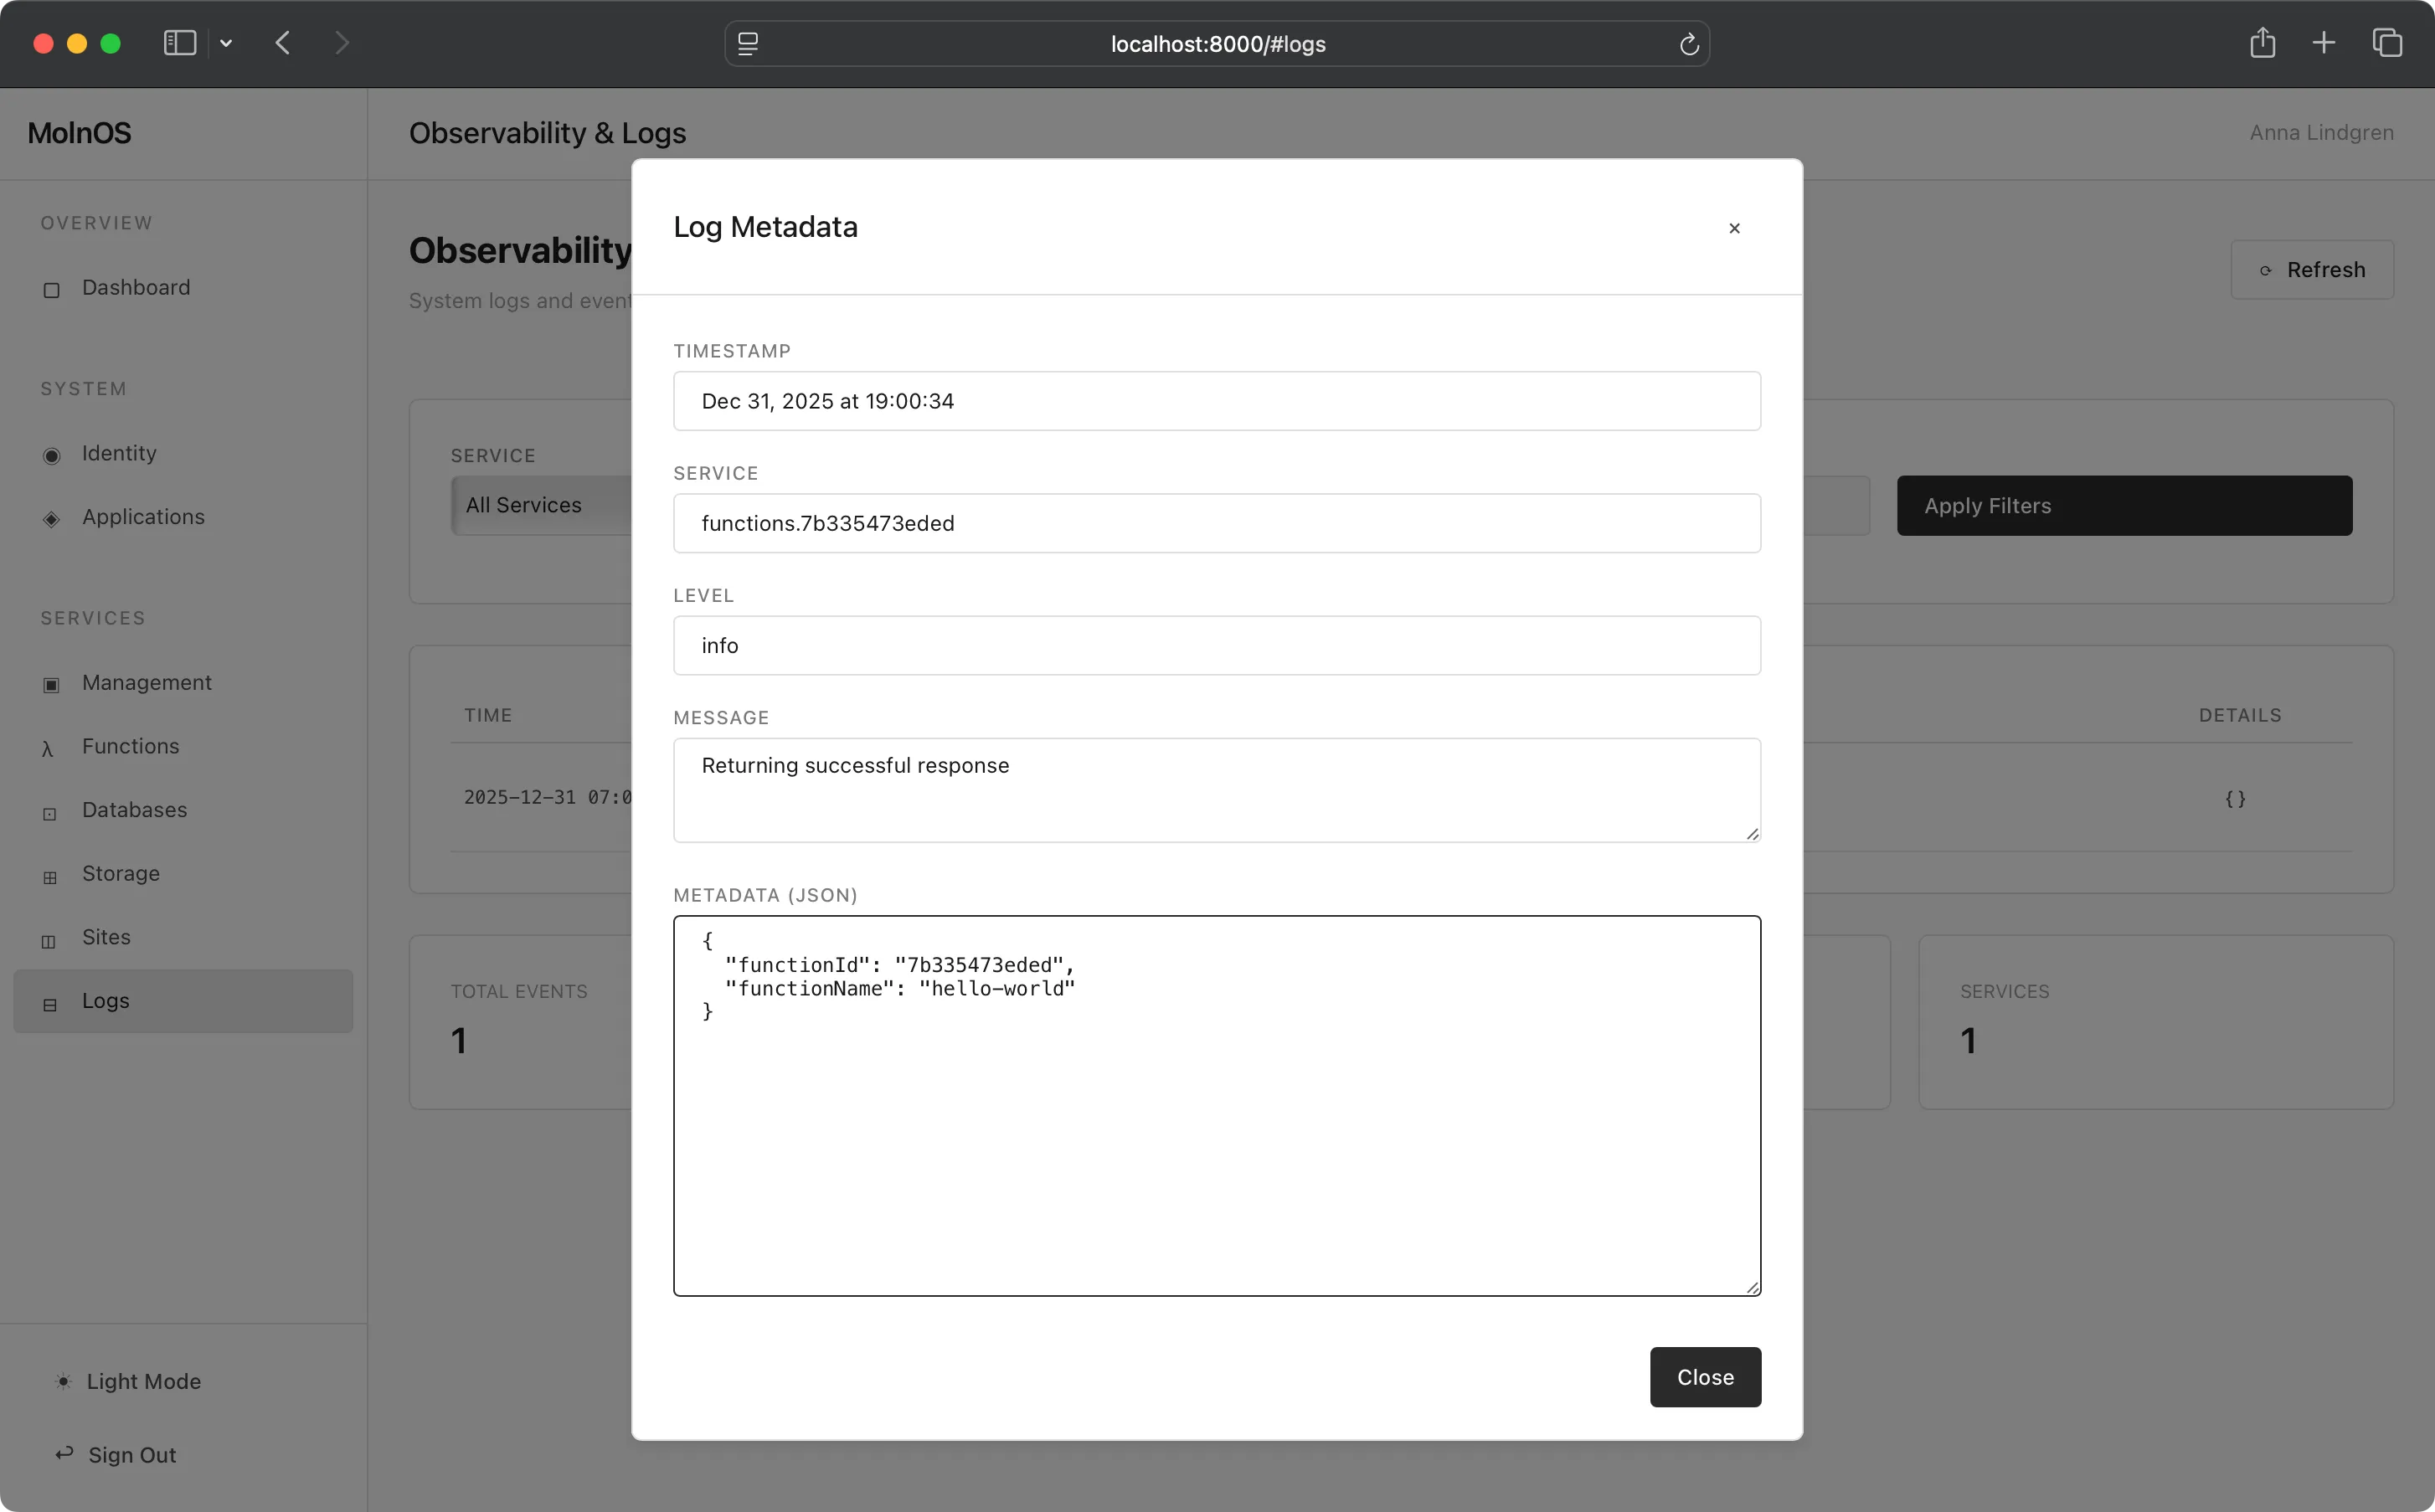
Logs carry both the contents of the log itself, and also additional metadata that can be seen if clicking the “details” part of the log line.
To copy the log contents, just click the message and you’ll get all of its data copied to the clipboard!
Observability is managed through the HTTP API at /observability/* endpoints.
Log an Event
Section titled “Log an Event”POST /observability/eventsCreate a new log event:
{ "service": "my-service", "level": "info", "message": "User login successful", "metadata": { "userId": "user123", "ip": "192.168.1.1", "userAgent": "Mozilla/5.0..." }}Response:
{ "success": true, "event": { "id": "evt_abc123", "timestamp": 1703000000000 }}Query Logs
Section titled “Query Logs”GET /observability/events?startTime=1703000000000&endTime=1703086400000&service=my-service&level=error&limit=100&offset=0All query parameters are optional:
startTime- Start timestamp in millisecondsendTime- End timestamp in millisecondsservice- Filter by service name (prefix match)level- Filter by log level (info, warn, error, debug)search- Search term to filter log messageslimit- Maximum events to return (default: 1000)offset- Pagination offset (default: 0)
Response:
{ "success": true, "count": 42, "events": [ { "id": "evt_abc123", "timestamp": 1703000000000, "service": "my-service", "level": "error", "message": "Database connection failed", "metadata": { "error": "ECONNREFUSED", "host": "localhost", "port": 5432 } } ]}Get Log Statistics
Section titled “Get Log Statistics”GET /observability/statsReturns statistics about stored logs:
{ "success": true, "stats": { "totalLogFiles": 120, "logFiles": [ { "name": "2025-12-19.log", "size": 1048576, "date": "2025-12-19" } ] }}Clean Up Old Logs
Section titled “Clean Up Old Logs”DELETE /observability/events/cleanupDelete logs older than specified days:
{ "olderThanDays": 30}Response:
{ "success": true, "deletedCount": 15}Flush Log Buffer
Section titled “Flush Log Buffer”POST /observability/flushForces the write buffer to flush to disk immediately:
{ "success": true}Get System Metrics
Section titled “Get System Metrics”GET /observability/metrics/systemReturns real-time system and process metrics:
{ "success": true, "metrics": { "timestamp": 1735161600000, "system": { "loadAvg": 0.45, "uptime": 3600, "platform": "linux", "arch": "arm64" }, "memory": { "total": 536870912, "free": 268435456, "used": 268435456, "usagePercent": 50.0 }, "process": { "heapUsed": 45678912, "heapTotal": 67108864, "external": 1234567, "rss": 89123456, "uptime": 3600, "pid": 1234 } }}Observability operations using the MolnOS CLI:
# Query/list all logsmolnos logs
# Query logs with filtersmolnos logs --service my-servicemolnos logs --level errormolnos logs --search "user login"molnos logs --limit 50 --offset 100
# Get log statisticsmolnos logs stats
# Log an eventmolnos logs event '{"service":"my-service","level":"info","message":"User logged in","metadata":{"userId":"123"}}'
# Clean up old logs (delete logs older than N days)molnos logs cleanup 30
# Flush log buffer to diskmolnos logs flush
Note: The CLI supports time range filtering via --start-time= and --end-time= flags. Real-time tailing is not yet available.
Permissions
Section titled “Permissions”Observability requires appropriate permissions to log events and query logs:
observability.event.create- Create log eventsobservability.event.read- Query and view logsobservability.event.delete- Clean up old logsobservability.stats.read- View statisticsobservability.buffer.write- Flush log bufferobservability.metrics.read- View system metrics
Best Practices
Section titled “Best Practices”Structured Logging
Section titled “Structured Logging”Use the metadata field to add structured data to your logs. This makes querying and analysis much easier:
{ "service": "api", "level": "info", "message": "Request processed", "metadata": { "requestId": "req_123", "method": "POST", "path": "/api/users", "duration": 45, "statusCode": 201 }}Appropriate Log Levels
Section titled “Appropriate Log Levels”- Use
debugfor detailed diagnostic information (disable in production) - Use
infofor general informational messages about normal operations - Use
warnfor potentially harmful situations that don’t prevent operation - Use
errorfor error events that still allow the application to continue
Include Context
Section titled “Include Context”Always include relevant context in log messages:
- Request IDs for tracing requests across services
- User IDs for user-related operations
- Resource IDs for operations on specific resources
- Error details including error messages and stack traces